
A map is an aerial projection of some terrain. Maps will usually have special symbols to represent objects or features.
Map Type
The “Topographic” map which is a mixture of contour, cadastral and feature maps is the type of map usually used for hiking and bushwalking.
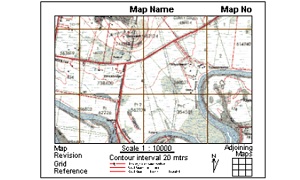
Map Name
This is the name of the map! Some people prefer to use the map name than the map number. The map name is a “human readable” name to use when referring to a particular map. For example, Wagga Wagga. This is name of the 1:25,000 map with the Map Number 8327-1-N.
Map Number
The number of the map indicates the scale and the location in Australia the map presents. Maps are drawn to different scale.
1 : 1,000,000 scale map series are numbered in a letter number combination e.g. SH53. SC is north of Australia to SK in the south, 49 in the West to 56 in the east.
1 : 250,000 scale map series each of the above maps are divided in 16 smaller maps. 01 top left, 04 top right, 13 bottom left, 16 bottom right.
Therefore the 1 : 250,000 map SI55-15 “Wagga Wagga” covers area 147° 00′ E to 148° 30′ E, 35° 00′ S to 36° 00′ S
1 : 100,000 scale map series A map number in this series will be something like 8327-1-N. This is a different numbering system to the one above. The first two digits indicates the horizontal position of the map on the Australia continent, (14 in west, 96 in east). The second two digits indicates the vertical position, (77 in north, 10 south). Therefore the 1 : 100,000 map 8327 “Wagga Wagga” covers area 147° 00’E to 147° 30′ E, 35° 00′ S to 35° 30′ S
1 : 50,000 scale map series
1 : 25,000 scale map series. The second set of digits indicates the quadrant of the 1 : 100,000 map. The quadrants start with 1 being the North East, rotating clockwise to 4 being the North West. The last character indicates the North or South half of the quadrant. The result of this is that a 1 : 100,000 map is composed of 8 separate 1 : 25,000 maps. The maps produced by this numbering system looks like this:
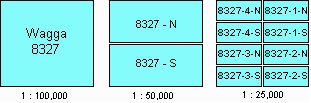
When using a grid reference, it is useful to indicate which map you are using both by name and number. For example, 8727-1-N Wagga Wagga 246228 to indicate a point on the Wagga Wagga map.
Map Revision
Read the small print. Typical small print indicate such things as:-
Map Reliability – when the last time the area and the map were checked.
Map Accuracy – +/- 25 metres in the horizontal position and +/- 10 metres in elevations.
Road classifications – This one is an important one. The roads on the map are classified according to their intended function as part of the national road system. It has not indicate the condition of the roads.
Scale
Every map has a scale. The maps that we will be using have scales from 1:100,000 down to 1:25,000. These numbers indicate the relationship between the size of features on the map and the size of features in real life. For a 1:100,000 map, 1cm on the map represents 1km in real life. For a 1:25,000 map, 4cm on the map represents 1km in real life.
Adjoining Maps
This little diagram shows you the numbers and names of the maps on the eight grid squares surrounding the map you are looking at.
Knowing how the maps fit together helps you understand which maps join onto the one you’re looking at, so you know which maps you need.
Grid Convergence
The grid convergence device shows the convergence between grid, true and magnetic north. For more information, check the notes in Compass Basics.
Universal Grid Reference
This panel of the map is useful to some people – note that it presents a different way of presenting the grid reference. Rather than using the map number or name, use the “100 000 METRE SQUARE IDENTIFICATION” so a reference becomes”FA754573″ instead of “8626-I-N CORIN DAM 754573”. That’s a lot shorter, so it may be worth using, as long as you mention on your navigation data sheet that you’re using these references. Note that one of these grids (eg: FA) covers more than one map, so it’s much easier to use the name or number of the map, such as “CD 754573” where you have previously stated that CD is short for “8626-I-N Corin Dam”.
Contours
Contours are usually orange/brown lines indicating points of the same height. The map will specify what the “contour interval” is. The contour interval is the vertical distance between points represented by the contour lines. For example, on a 1:25,000 map, the contour interval is 10m while on a 1:100,000 map, the contour interval is 20m.
If the contour lines are close together, that means the terrain is steep, because you change height quickly in a short distance. If the contour lines are far apart, then the terrain is less steep, since you have to move further across to go up (or down) the same height.
Contour lines will also tell you a lot about the terrain. For example, you might find a nice place to camp by noticing that there is a clearing by a river, and that clearing has no contour lines crossing it – indicating that the terrain is flat.
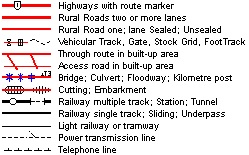
Legend
The legend shows the colours and symbols used on the map to represent different features of the terrain. Features are represented by special symbols, vegetation markings and watercourses.
Roads and Trails
The markings used for roads indicate only that some kind of road was there when the map was made. The roads may not necessarily be open to the public (ie: a private road), and may have changed in quality since the map was made. For example, a four-wheel drive track may have been graded to make an unsealed road or fire trail.
Vegetation
Always take notice of the vegetation indicated on the map, but don’t trust the map exclusively! Where the map says “dense forest”, and you know that it is a eucalypt forest, you can bet that the walking will be fairly easy, though there will be a lot of leaf litter and sticks. Where the map says “light forest”, you can bet that the walking will be hard, because although there are fewer trees, the ground will be thick with Tea-Tree.
Watercourses
Water is very important to hikers. Water can also be very dangerous to hikers. It’s useful know where water is in case you need to get some.
Rivers and lakes will be shown as bodies of water – blue patches on the map. Creeks and streams will be blue lines, with the width of the blue line usually indicating the flow of the creek (or at least the width of the stream). Other blue lines you are likely to find are broken blue lines, representing intermittent streams or dotted blue lines representing underground rivers or aque ducts.
An intermittent stream is a watercourse that is usually dry, but starts to flow in heavy rain. These can be useful to you as a source of water in the wet season, or an obstacle if you’re hoping to cross them.
Other Information
There is some information in the border of the map which is useful, some interesting, and some life-saving.
Written by Peter Shave